Legal ops metrics measure whether the legal function runs like a disciplined business unit rather than a cost center that resists scrutiny. Five buckets matter: spend, cycle time, volume, supplier performance, and tool or process adoption. Everything else is noise until those five are solid.
TL;DR:
- Standardizing matter tagging and invoice coding is essential before trusting spend and cycle time metrics, especially at the early stage of legal operations.
- Tracking only two or three of the five key metric categories typically indicates a nascent legal ops team, while full five-category coverage marks a mature operation.
- Automating governed intake and routing processes improves data quality, making legal metrics more reliable and audit-ready for executive decision-making.
- Benchmarks should be segmented by revenue band and industry to ensure comparisons are meaningful and avoid misleading leadership conversations.
- Regular reporting cadences align with team maturity, with weekly updates for operational metrics and quarterly reviews for strategic KPIs to support governance.
Table of Contents
- What Are Legal Ops Metrics, and How Do They Differ From Data?
- Which KPIs Should Legal Ops Teams Track First?
- How Do You Design a Legal Metrics Dashboard That Gets Used?
- How Should Metrics Change as Your Legal Ops Team Matures?
- Where Do Legal Departments Find Reliable Benchmark Data?
- Governance-First Automation: Why It Improves Metric Reliability
- Keep the Board Pack Tight and the Metrics Un-Gamable
- Turn Better Metrics Into a Governance Advantage
- Sources
- FAQ
What Are Legal Ops Metrics, and How Do They Differ From Data?
Raw data is an invoice line, a time entry, a matter tag in your intake system. None of that means anything on its own. A metric turns that data into a measurement: average contract turnaround time, total outside counsel spend last quarter. A KPI goes further. It ties a metric to a business decision the general counsel or CFO actually has to make, like whether to renegotiate a panel firm’s rates or expand headcount. Wolters Kluwer’s analysis makes this distinction the foundation of any credible metrics program: without it, teams report numbers nobody uses.
The most common failure mode is declaring KPIs before the underlying data is trustworthy. A legal ops manager builds a dashboard on inconsistent matter tags, half the invoices miscoded, and intake requests logged in three different formats. The dashboard looks sophisticated. It’s built on sand.
Fix the plumbing first:
- Standardize matter and practice-area taxonomy before you report anything.
- Force structured intake so every request carries the same fields.
- Audit invoice coding for consistency before trusting spend totals.
- Assign one owner accountable for data quality, not just report generation.
Data maturity builds in layers. Start with a handful of clean metrics and add complexity only as your taxonomy and governance improve, a sequencing CLOC’s Core Metrics Initiative recommends explicitly.
Which KPIs Should Legal Ops Teams Track First?
Legal ops metrics cluster into five categories, and mature teams instrument each one differently depending on what decision it feeds. This taxonomy comes from HireLegalOps’ 2026 KPI framework, which found most teams track only two or three buckets reliably; full five-category coverage is a marker of a Stage 4 operation.
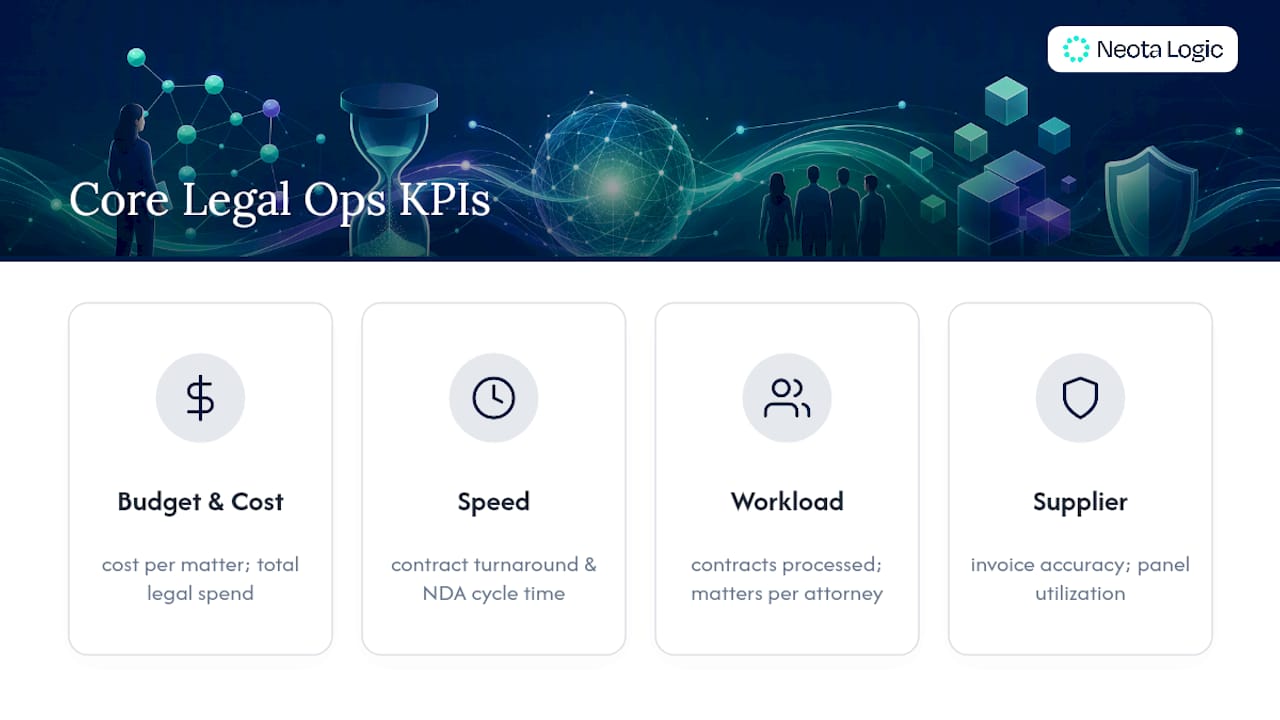
Budget and cost. Total legal spend, outside versus inside counsel ratio, cost per matter, and alternative fee arrangement (AFA) adoption rate. Cost per matter is simple: total spend on a matter type divided by matter count for the period. It exposes whether complexity or inefficiency is driving cost, not just volume.
Speed and responsiveness. Contract turnaround time, NDA cycle time, and intake-to-assignment lag. These are the numbers that determine whether the business sees legal as a partner or a bottleneck.
Workload and capacity. Contracts processed, matters opened and closed, matters per attorney. This is where headcount conversations start.
Supplier performance. Rate compliance, invoice accuracy, panel utilization, and diversity metrics for outside counsel.
Tool and process health. CLM adoption rate, self-serve intake rate, template reuse, knowledge base reuse. Self-serve rate is calculated as requests resolved without attorney intervention divided by total requests. A rising number here usually means your intake automation is doing its job.
How Do You Design a Legal Metrics Dashboard That Gets Used?
Operational dashboards and strategic dashboards serve different people and should never share a screen. Operational views track the live queue: open intake requests, matters overdue for review, invoices pending approval. Legal ops managers and paralegals check these daily. Strategic views track trend lines and peer benchmarks: spend as a percentage of revenue over eight quarters, cycle time against industry medians. GCs and CFOs check these monthly or quarterly.
Build dashboards in this order:
- Pick three to six core metrics tied to a decision someone actually makes. If a metric doesn’t answer a question stakeholders repeatedly ask, it doesn’t belong on the dashboard yet, a filtering principle Ironclad’s guidance on legal operations dashboards states plainly.
- Break cycle time into stages, intake, assignment, drafting, review, signature, instead of reporting one blended number. That’s how you find where a contract actually stalls.
- Add drill-downs and filters by matter type, business unit, and attorney, refreshed on a cadence that matches the audience: real-time for operational, weekly or monthly for strategic.
- Choose visualizations that match the question: trend lines for spend, funnel charts for cycle stages, distribution charts for workload balance.
Pro Tip: On executive-facing cards, add one line of context next to every number and a red/amber/green status column. A number without context gets misread; a status color gets acted on.
How Should Metrics Change as Your Legal Ops Team Matures?
The right KPIs depend on your team’s stage, not on what looks impressive in a boardroom deck.
- Early stage (first ops hire): Focus entirely on data hygiene, intake structure, matter tagging, invoice coding. The legal ops manager owns everything because there’s no one else.
- Mid-stage: Layer in spend and cycle time metrics once data is reliable. Ownership starts splitting: a CLM administrator owns contract pipeline metrics, an e-billing specialist owns vendor and spend metrics, a pattern HireLegalOps documents as the typical Stage 3 handoff.
- Later stage: Add supplier performance and tool adoption metrics across the full portfolio.
- Stage 4: Support a unified executive view spanning all five buckets, refreshed and reconciled across systems.
Cadence follows stage: operational metrics move weekly, spend and cycle metrics move monthly, and board-level KPIs move quarterly, aligned to when the GC or CFO actually reviews them.
Where Do Legal Departments Find Reliable Benchmark Data?
The ACC’s 2026 Law Department Management Benchmarking Report is the industry’s most cited source for spend and staffing bands, drawing on 576 legal departments across 45 countries. It puts median total legal spend at 0.43% of revenue, but that median means little without segmentation.
- Segment by revenue band before comparing. A $200 million company and a $20 billion company have structurally different spend ratios.
- Segment by industry. Regulated sectors like financial services carry heavier compliance overhead than most.
- Treat CLOC’s core metrics taxonomy as the common vocabulary that makes any benchmark comparison valid in the first place, since comparing numbers defined differently is worse than not comparing at all.
- Commission a tailored peer report when public benchmarks don’t match your industry or size band closely enough to guide a real decision.
Raw medians without segmentation risk misleading the exact leadership conversation they’re meant to inform.
Governance-First Automation: Why It Improves Metric Reliability
Bad intake data breaks every metric downstream. When requests arrive unstructured, matter tagging turns into guesswork and your cycle-time numbers become fiction. Governed classification and routing fix that at the source: every request enters with consistent fields, gets tagged consistently, and moves through a workflow that logs every action.
Neota Logic’s platform classifies and routes legal requests, applies decision logic consistently, and audits every action for review. In a case study with Global Risk Solutions, governed workflows produced measurable gains in turnaround time and user engagement, the kind of evidence that holds up when a CFO asks why the numbers should be trusted.
Audit trails and version history don’t just satisfy compliance. They give your metrics a paper trail an executive can verify instead of taking on faith.
Keep the Board Pack Tight and the Metrics Un-Gamable
Six KPIs are enough for a board pack: spend, velocity, leverage, risk, and stakeholder satisfaction cover the ground a GC and CFO need. More than that buries the decision in noise.
Matter volume alone is a trap. A rising matter count without velocity or outcome context can mean growth or dysfunction, and a board pack that can’t tell the difference is worse than no metric at all.
— Patrick
Turn Better Metrics Into a Governance Advantage
Clean legal ops metrics start with clean intake, and that’s exactly where most manual processes break down. Neota Logic is is built as governed AI infrastructure, not a point solution bolted onto your existing stack, so every request that enters gets classified, routed, and logged the same way every time.
That consistency is what turns a spend or cycle-time number into something a CFO will actually act on, because the audit trail behind it can withstand scrutiny. If your dashboards are only as good as the intake data feeding them, an audit trail and version history for every workflow decision is the fix, not another reporting layer stacked on top of bad inputs. Explore the platform built for legal teams or read the blueprint for a high-performing legal function to see how governed intake changes what your metrics can prove. When you’re ready to see it against your own workflows, request a demo.
Sources
- 2026 Law Department Management Benchmarking Report
- Legal Operations KPIs and Metrics 2026
- Measure what matters: A strategic approach to legal operations metrics
- Core Metrics: Creating a Common Language for Legal Operations
FAQ
What Are the Five Key Legal Ops Metrics Categories?
Budget and cost, speed and responsiveness, workload and capacity, supplier performance, and tool and process health, a taxonomy detailed in HireLegalOps’ KPI framework.
What Are Operation Metrics in a Legal Department?
Operation metrics measure the day-to-day mechanics of legal work, like intake-to-assignment time, matters opened and closed, and invoice accuracy, distinct from strategic KPIs tied to budget decisions.
What Are Five Examples of Metrics to Measure Legal Team Performance?
Cost per matter, contract turnaround time, outside versus inside counsel spend ratio, CLM adoption rate, and rate compliance across your outside counsel panel.
What Are the Most Important KPIs for a Law Firm or Legal Department?
Total legal spend as a percentage of revenue, cycle time by stage, matters per attorney, supplier rate compliance, and self-serve intake rate consistently top the list for mature legal operations teams.
How Often Should Legal Ops Metrics Be Reported?
Operational metrics belong in weekly or monthly ops reviews, while spend, velocity, and risk KPIs belong in a quarterly board pack for the GC and CFO.
Can Automation Improve the Reliability of Legal Ops Metrics?
Yes. Governed automation platforms like Neota Logic standardize intake classification and log every workflow action, which reduces the manual tagging errors that distort cycle time and spend data.
Recommended
Ready to make your AI workflows defensible?
Book a demo and we'll walk one of your real processes through Neota.
Book demo